You've probably got that spreadsheet open right now. Supplier payments exported from the bank. A few customer receipts in foreign currency. Some rows are clean, some have blank cells, some amounts came through as text, and someone has already asked for the “average” transaction value before close of business.
That's where most Excel tutorials stop being useful. They show a neat column of numbers and a neat =AVERAGE() formula, but finance work in South Africa usually isn't neat. Export revenue lands in different cycles, FX charges don't behave consistently, and a single large cross-border transfer can make a simple mean look more informative than it really is.
If you want to know how to calculate a mean on Excel properly, you need more than one formula. You need the basic arithmetic mean, the conditional mean for segmented analysis, and in some situations a weighted mean so the result reflects economic reality rather than spreadsheet convenience.
Beyond Basic Sums An Introduction for Finance Teams
A junior analyst often starts by scanning the column and guessing. If the invoice values look broadly similar, that might feel harmless. It isn't. Once your workbook mixes export receipts, local supplier payments, bank charges, and occasional once-off settlements, your eye stops being a reliable tool.
Take a common month-end scenario. You've downloaded a payments report with ZAR values, foreign currency settlements, and a few notes typed into the amount columns. The MD wants the average supplier payment. Treasury wants the average FX-related charge. Sales wants the average export receipt size. Those are three different questions, and they usually need three different approaches.
A mean turns a long list of numbers into one summary figure. That's why controllers use it constantly. It helps you compare periods, branches, customers, and payment corridors without reading every line one by one. But the number only helps if the method matches the decision you're trying to support.
For practical reporting, I'd separate the job like this:
- Use a simple mean when you want a quick overall view of a clean data range.
- Use a conditional mean when you only want one supplier, one currency, or one transaction type.
- Use a weighted mean when values don't carry equal importance, especially in FX analysis.
That difference matters more than most Excel guides admit. A simple average can be fine for local invoice amounts, but it can mislead badly when export receipts vary sharply in size.
If you're also trying to explain movement rather than just summarise it, it helps to track cash flow with waterfall charts. Mean calculations tell you what's typical. A waterfall chart helps you show what changed and why.
Finance teams don't get paid for producing averages. They get paid for producing averages that support the right decision.
The Foundation Calculating a Simple Mean with AVERAGE
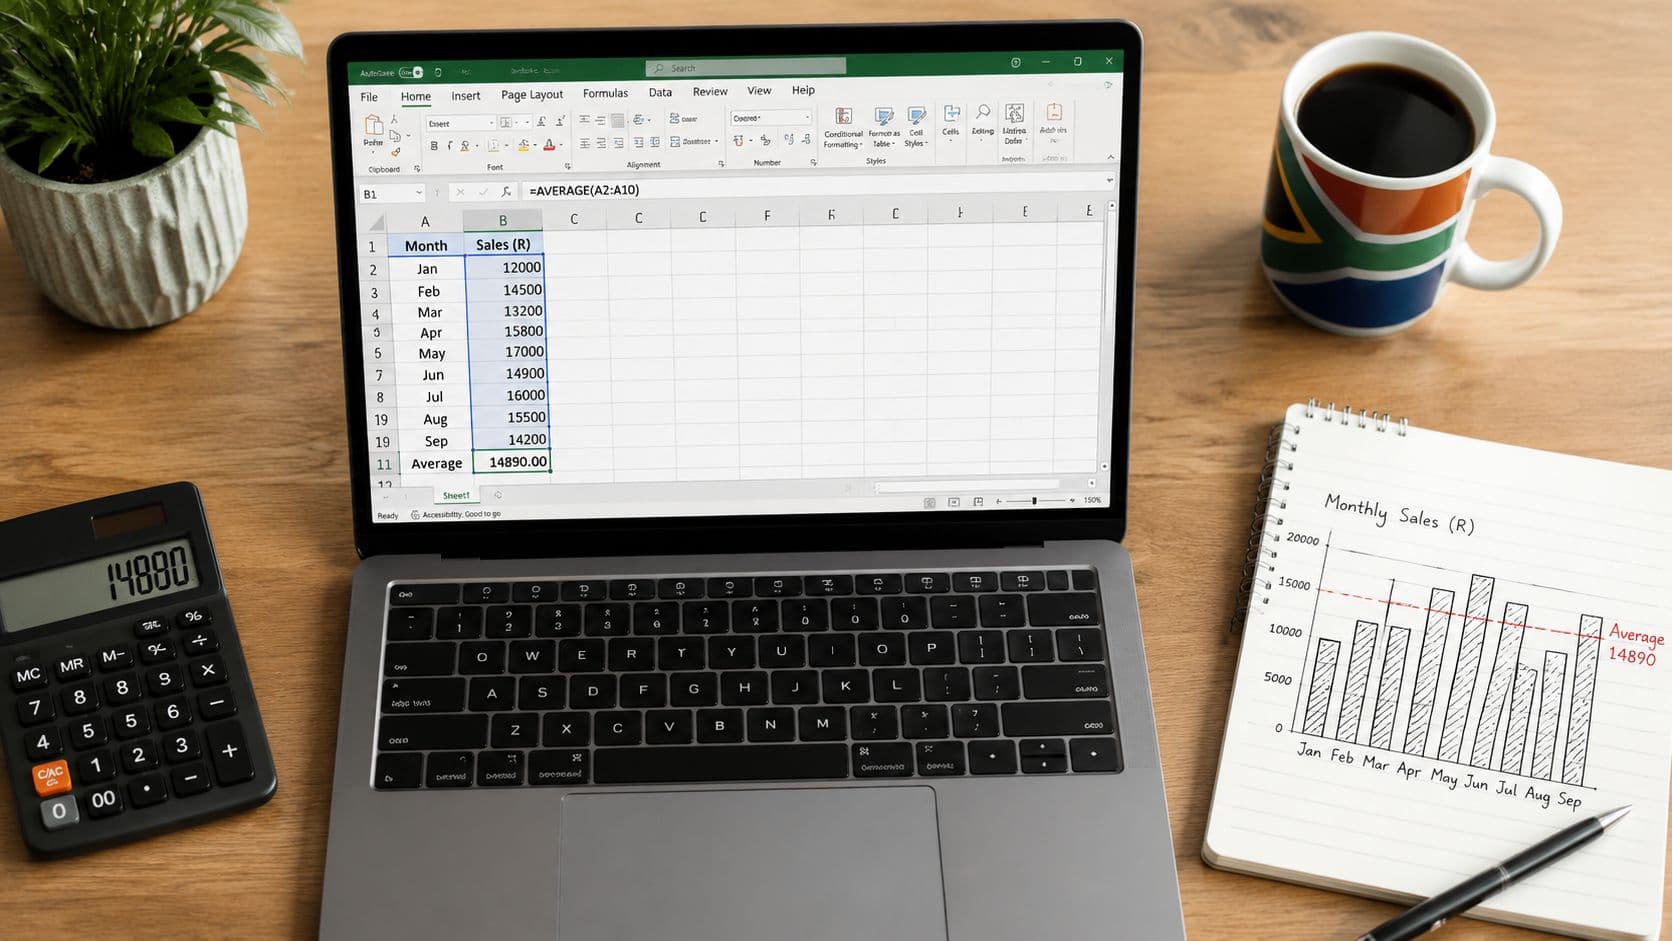
The starting point is =AVERAGE(range). In South Africa, Excel's mean calculation follows the same arithmetic rule used in statistics: add the values and divide by how many values you have. Microsoft states that the AVERAGE function returns the arithmetic mean and uses =AVERAGE(A1:A20) as its standard example for a 20-cell range in its AVERAGE function documentation.

The quickest way to calculate it
If your invoice values sit in cells B2:B12, type:
=AVERAGE(B2:B12)
Press Enter and Excel returns one value. That's your arithmetic mean.
You can also click the target output cell, go to the Formulas tab, choose AutoSum, then Average. That's useful when you're working quickly in a month-end workbook and want Excel to suggest the range.
Why this works in real finance files
Simple doesn't mean simplistic. AVERAGE is reliable because Excel ignores blank cells in the selected range. In practical business reporting, that's useful for monthly FX cost tracking, export invoicing, or supplier payment analysis. If you enter transaction values from A1 to A20, Excel returns a single mean value and ignores blanks in the range, as Microsoft describes in the same support page linked above.
That behaviour matters in exported reports. You might have:
| Row type | Included in AVERAGE |
Why it matters |
|---|---|---|
| Numeric amount | Yes | This is what should drive the result |
| Blank cell | No | Empty rows won't dilute the mean |
| Text label | No | Notes and headers won't count as values |
A practical local example
Say you're reviewing local supplier invoices for the month. Column C contains invoice values in ZAR. Some rows are blank because a supplier line was cancelled. One row contains a typed note like “credit pending”.
Use:
=AVERAGE(C2:C40)
That gives you a clean overall average for the invoices in that selected range, without the blanks or text entries affecting the outcome.
Practical rule: Use
AVERAGEwhen the business question is broad and the selected range is already the population you want.
What works and what doesn't
What works:
- Clean numeric ranges where all included values belong in the calculation
- Monthly summary checks such as average supplier invoice size
- Quick dashboards where you need one headline figure fast
What doesn't:
- Mixed populations such as local and export payments in one result when you only need one category
- Skewed transaction sets where one large transfer can pull the average away from what feels typical
- Dirty imports where some numbers were stored as text and inadvertently excluded
If the workbook is clean and the question is broad, AVERAGE is the right tool. If the question is narrower, you need to filter before you average.
Deeper Insights with Conditional Averages
The first time AVERAGE lets you down is usually when someone asks a better question.
Not “what's our average payment value?” but “what's our average USD payment fee?” or “what's the average invoice value for this supplier only?” A simple mean can't answer that unless you manually filter the sheet or build a separate table. That's where AVERAGEIF and AVERAGEIFS become useful.
Ablebits notes that Excel supports AVERAGEA, AVERAGEIF, and AVERAGEIFS, and that AVERAGEIF and AVERAGEIFS are used when the mean must be filtered by one or more criteria. It highlights practical use cases such as averaging only ZAR-settled transactions, only South African supplier invoices, or only trades above a threshold in its guide to mean, median, and mode in Excel.

When one condition is enough
Use AVERAGEIF when you're filtering on a single rule.
Suppose:
- Column A = supplier name
- Column B = invoice amount
You want the average invoice value for Supplier Alpha only.
Use:
=AVERAGEIF(A2:A100,"Supplier Alpha",B2:B100)
Excel checks the supplier names in A2:A100. Where the name matches "Supplier Alpha", it averages the corresponding values from B2:B100.
That's useful when you're reviewing a supplier relationship and need one number that is specific to that supplier, not the whole payables ledger.
When finance needs more than one filter
Use AVERAGEIFS when one condition isn't enough.
Suppose you've got:
- Column A = currency
- Column B = supplier country
- Column C = fee amount
You want the average fee for transactions that are both:
- in ZAR, and
- linked to South African suppliers
Use:
=AVERAGEIFS(C2:C100,A2:A100,"ZAR",B2:B100,"South Africa")
That's a far better finance answer than averaging every fee line together.
Where this becomes powerful in export and FX work
Conditional averages are where spreadsheet analysis starts to resemble management reporting rather than admin. You can answer questions like:
- Average fee by currency so you can compare payment corridors
- Average invoice value above a threshold when you want to isolate larger commercial settlements
- Average export receipt by customer if customer concentration is becoming a concern
A raw average across the whole file often hides the useful story. The main pitfall, as Ablebits notes in the source above, is using an unfiltered mean on skewed payment data. A few large cross-border transfers can pull the average far above the typical transaction size.
If the question includes the word “only”, use
AVERAGEIForAVERAGEIFS. “Only USD”, “only one supplier”, “only paid transactions”. That's the signal.
A quick decision guide
| Business question | Best function |
|---|---|
| Average of the whole clean range | AVERAGE |
| Average for one supplier | AVERAGEIF |
| Average for one currency and one supplier country | AVERAGEIFS |
| Average where values should carry different importance | Weighted formula |
The mistake I see most often is analysts using AVERAGE because it's faster to type, then trying to explain the wrong result in a meeting. It's better to spend another minute on the formula than half an hour defending a number that was never fit for purpose.
Calculating a Weighted Mean for Accurate FX and Cost Analysis
A simple average assumes every observation deserves equal weight. In finance, that often isn't true.
If you bought foreign currency twice in a month, one small amount and one much larger amount, taking the simple mean of the two rates can give you a neat answer that doesn't reflect the actual average rate realised across the period. That's why treasury analysis often needs a weighted mean instead of a raw mean.

A recurring problem in Excel is deciding what to do when operational data includes blanks, zeros, text labels, and outliers. Standard tutorials rarely deal with the practicalities of South African SME finance data, where sporadic high-value cross-border payments are common and one large transfer can distort working capital analysis. That's why a raw mean often isn't the business-usable answer in volatile FX environments, as discussed in this overview of how to calculate mean in Excel.
Why simple averaging can mislead
Assume you're analysing export receipts with these fields:
- Column A = amount settled
- Column B = realised exchange rate
If one line is tiny and another is commercially significant, averaging the rates in Column B alone treats them as equals. That may be mathematically tidy, but it's financially weak.
A weighted mean solves that by giving more influence to the rate attached to the larger transaction amount.
The formula finance teams actually use
The standard Excel approach is:
=SUMPRODUCT(values,weights)/SUM(weights)
For an FX example:
B2:B10= realised exchange ratesA2:A10= foreign currency amounts or settlement values
Use:
=SUMPRODUCT(B2:B10,A2:A10)/SUM(A2:A10)
SUMPRODUCT multiplies each rate by its related amount, adds those products together, and then divides by the total amount. The result is a weighted mean.
That's the formula I'd use for:
- average realised FX rate on export proceeds
- average acquisition cost of foreign currency
- average unit cost where quantities differ meaningfully
- average shipping or handling cost per weighted commercial volume
A weighted mean answers “what was our true average given the size of each deal?”, not just “what's the middle of the listed rates?”
When to choose weighted over conditional
Use a conditional mean when you want to restrict the population.
Use a weighted mean when every included row belongs in the calculation, but not every row should count equally.
That distinction helps:
| Situation | Better method |
|---|---|
| Only USD transactions | AVERAGEIF or AVERAGEIFS |
| All FX deals, weighted by transaction size | SUMPRODUCT/SUM |
| Only one supplier and weighted by invoice volume | Weighted formula after filtering or on a helper set |
A short demonstration can help if you want to see the mechanics in action:
What controllers should watch
Weighted means are powerful, but they still depend on disciplined data prep.
- Match the ranges exactly. The values range and weights range must line up row for row.
- Check your units. Don't weight a ZAR cost by a unit count if the decision is really about currency exposure.
- Exclude noise early. If your import includes headings, totals, or text labels inside the range, fix that before relying on the output.
For FX and export analysis, this is often the difference between a spreadsheet that looks analytical and one that actually is.
Data Integrity Validating Calculations and Handling Errors
A formula that returns a number isn't automatically correct. That assumption causes more reporting trouble than the formula itself.
Excel is polite about bad inputs. It won't always shout when your range is wrong or when half your imported figures are stored as text. It will often just calculate something and leave you to discover later that the answer didn't reflect the dataset you thought you were using.
Microsoft notes that the technically correct mean is best calculated with =AVERAGE(range), which is the same result as =SUM(range)/COUNT(range) for numeric-only datasets. It also warns that AVERAGE ignores blank cells and text, and that text-formatted numbers may be excluded and alter the result without indication. That makes validation essential when you're working with imported ledger lines or banking exports, as described in Microsoft's guide to calculating an average.

The validation routine worth building
I'd treat every important average like this:
Check the selected range
Click into the formula and confirm the start and end cells reflect the intended population. Don't trust autofill blindly.Cross-check with
SUM/COUNT
If the dataset should be numeric-only, compare=AVERAGE(range)to=SUM(range)/COUNT(range). If they differ, something is off in the data.Look for text-formatted numbers
Exported bank and ERP files often hide this problem. A cell can look numeric but behave like text.Confirm blanks versus zeroes
A blank cell is ignored byAVERAGE. A zero is included. Those are not the same thing in reporting.
Common errors and what they usually mean
| Issue | Likely cause | Practical fix |
|---|---|---|
| Average looks too low | Zero values included when they shouldn't be | Check whether zero means “real zero” or “missing data” |
| Average looks too high | One large transaction dominates the dataset | Consider segmentation or a weighted approach |
| Result doesn't match expectation | Text-formatted numbers excluded | Convert the affected cells to real numbers |
#DIV/0! |
No numeric values in the evaluated set | Check the range and data type before recalculating |
Never sign off an average from an imported report until you've tested whether the file contains real numbers or numbers stored as text.
What a professional spot-check looks like
A quick spot-check doesn't need to be elaborate. Pick a small visible subset, calculate the average manually, and see if Excel's result aligns. Then check the status bar when you highlight a numeric range. It can give you a fast sense of whether the workbook is behaving as expected before you publish the number into management reporting.
The habit matters more than the complexity. Good finance work is often just careful repetition of small controls.
From Data Points to Strategic Decisions
A mean is never just a spreadsheet exercise. It's a judgement tool.
Use AVERAGE when you need a clean overall view. Use AVERAGEIF or AVERAGEIFS when the business question is selective and the population needs filtering first. Use SUMPRODUCT with SUM when transaction size should influence the result, especially for FX and export revenue analysis.
That's the practical answer to how to calculate a mean on Excel in a finance environment. The formula matters, but the bigger issue is matching the method to the question. A broad reporting question needs one kind of mean. Treasury, supplier analysis, and export performance often need another.
When teams get this right, averages become useful. You can compare payment behaviour across suppliers, understand what a “normal” export receipt looks like, and separate noise from trend in foreign exchange costs. When teams get it wrong, they still get a number. It just doesn't help them run the business better.
Clean data makes all of this faster. Organised payment exports, consistent transaction labels, and properly structured currency records reduce formula risk and shorten the gap between raw data and a decision the finance team can trust.
If your business handles cross-border payments regularly, clean transaction data and transparent FX execution make this kind of analysis far easier. Zaro gives South African finance teams a more structured way to manage international payments, with clear visibility across ZAR and USD activity, so you can spend less time cleaning exports and more time producing reporting that stands up in review.