At its heart, profit and loss is a simple idea: it tells you whether your business made or lost money over a set period. Think of it as your company's financial report card. It takes all the money you brought in and subtracts everything you spent to get there.
The final number tells the real story of your profitability.
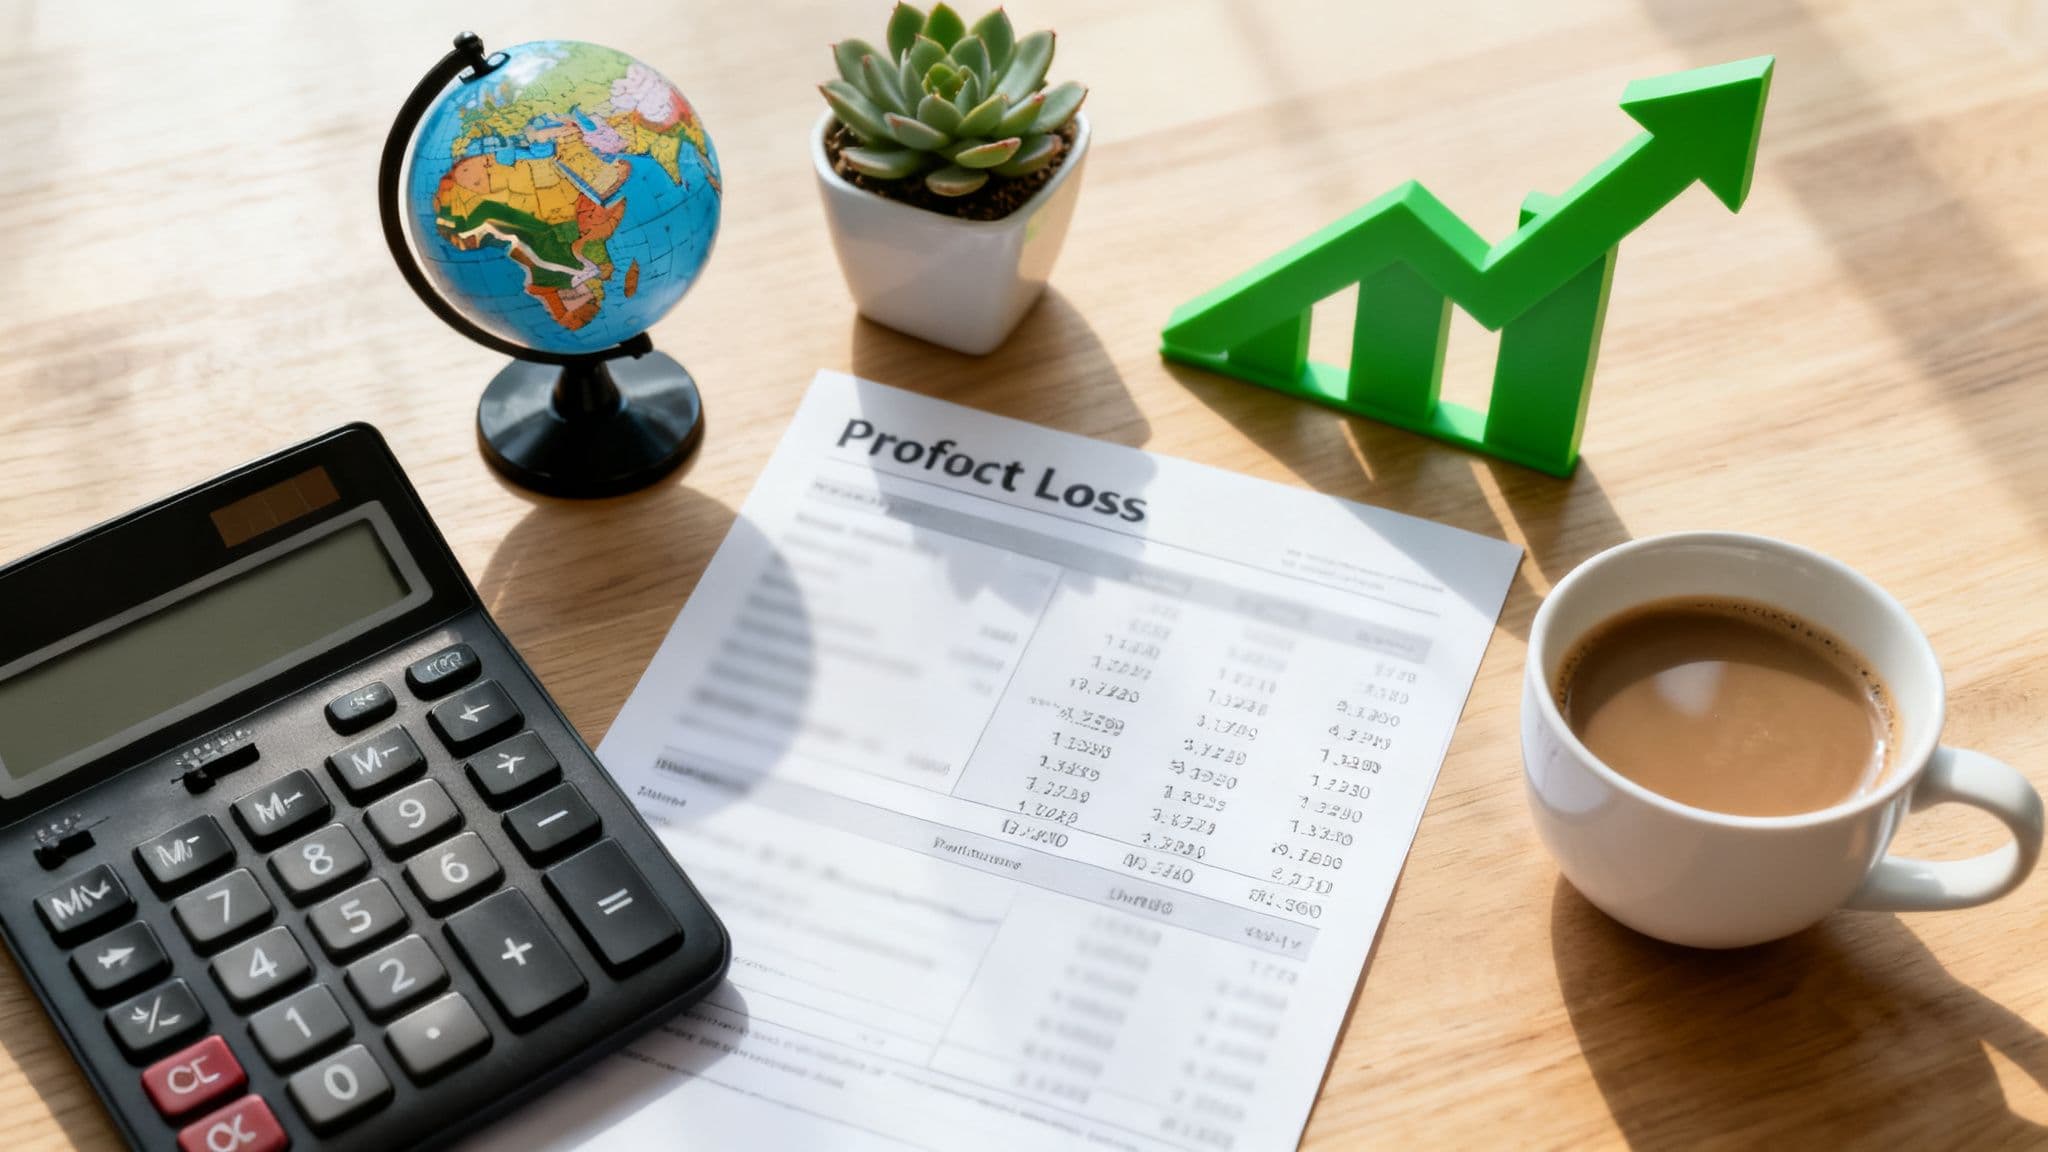
Seeing Your Business Performance on a Single Page
A profit and loss (P&L) statement isn't just a document for your accountant or the taxman. It’s one of the most powerful tools you have for understanding the health of your business. It goes beyond just looking at your bank balance to answer the questions that really matter.
By laying out all your financial activity in one place, the P&L gives you a clear map to guide your decisions.
This statement helps you answer critical questions like:
- Are we selling enough? It shows you whether your sales are growing, flatlining, or heading in the wrong direction.
- Are our production costs under control? You can see exactly how much it costs to make your products or deliver your services.
- Are our daily expenses too high? The P&L reveals if things like rent, salaries, and marketing are eating up too much of your income.
- Are we actually profitable? After every single cost is accounted for, this is the bottom line.
Why Your P&L is Crucial for a South African Business
For any South African SME, particularly one that trades internationally, the P&L is indispensable. It's your guide through the complexities of our local economy, showing you exactly how inflation is hitting your operating costs or how a volatile Rand is impacting the value of your overseas sales.
Getting a handle on these moving parts is absolutely vital for building a business that lasts.
A well-kept P&L statement gives you a powerful lens to view your operations. It highlights what’s working well and exposes weaknesses before they snowball into major issues. For example, the South African cross-border payments market is worth around USD 330 million. If you're not managing these international payments efficiently, the high fees and poor exchange rates can quietly eat away at the profits you see on your P&L. You can learn more about the scale of South Africa's cross-border transfers and what it means for your costs.
A profit and loss statement doesn’t just report on the past. It gives you the insight you need to build a more profitable future. It turns cold, hard numbers into real business intelligence.
When you truly understand your P&L, it stops being an intimidating spreadsheet and becomes your most trusted business advisor. It gives you the confidence to steer your company forward, knowing that every decision you make is backed by a clear picture of its financial impact.
Breaking Down Your Profit and Loss Statement
To really get to grips with profit and loss, you need to understand its primary tool: the Profit and Loss (P&L) statement. Think of it as your business's financial story, told from top to bottom. Each line peels back another layer, revealing exactly how your company performed over a specific time—be it a month, a quarter, or a full year.
The whole thing is a simple, logical flow. You start with your total sales and, through a series of subtractions, you end up with your final profit or loss. Let's walk through the story it tells, line by line.
The Top Line: Revenue
It all begins with revenue, often called the 'top line'. This is the total amount of money your business earned from selling its goods or services before a single cost is taken out. It’s the sum of all your sales invoices. Simple as that.
For instance, if your Cape Town-based rooibos tea company sells R500,000 worth of tea to customers in South Africa and overseas during a quarter, your revenue is R500,000. This number is the starting point for everything that follows.
Cost of Goods Sold and Gross Profit
Right below revenue, you’ll find the Cost of Goods Sold (COGS). These are the direct costs of producing what you sell. This includes things like the raw tea leaves, packaging materials, and the wages of the people who physically blend and pack the tea.
COGS doesn't include indirect costs like your marketing budget or the accountant's salary. It’s purely about the cost of making your product. Subtracting COGS from your revenue gives you a powerful first clue about your profitability.
Revenue – Cost of Goods Sold = Gross Profit
This figure, Gross Profit, shows what’s left over from your sales after paying for the direct costs to produce your goods. It’s a crucial health check. Is your pricing high enough to comfortably cover your production costs? Gross profit gives you the answer.
Operating Expenses: The Cost of Doing Business
Next up are Operating Expenses (OpEx). These are all the costs needed to keep the lights on and the business running, whether you sell one unit or one million. They aren't directly tied to a single product.
Common operating expenses include:
- Salaries and Wages: For your admin, sales, and marketing teams.
- Rent and Utilities: The cost of your office, factory, or warehouse.
- Marketing and Advertising: Everything you spend to attract customers.
- Insurance: Covering your business against risks.
- Professional Fees: What you pay your lawyers and accountants.
Deducting OpEx from your gross profit starts to paint a much clearer picture of your company's operational efficiency.
This is where your P&L goes from just being a report card to a strategic tool.
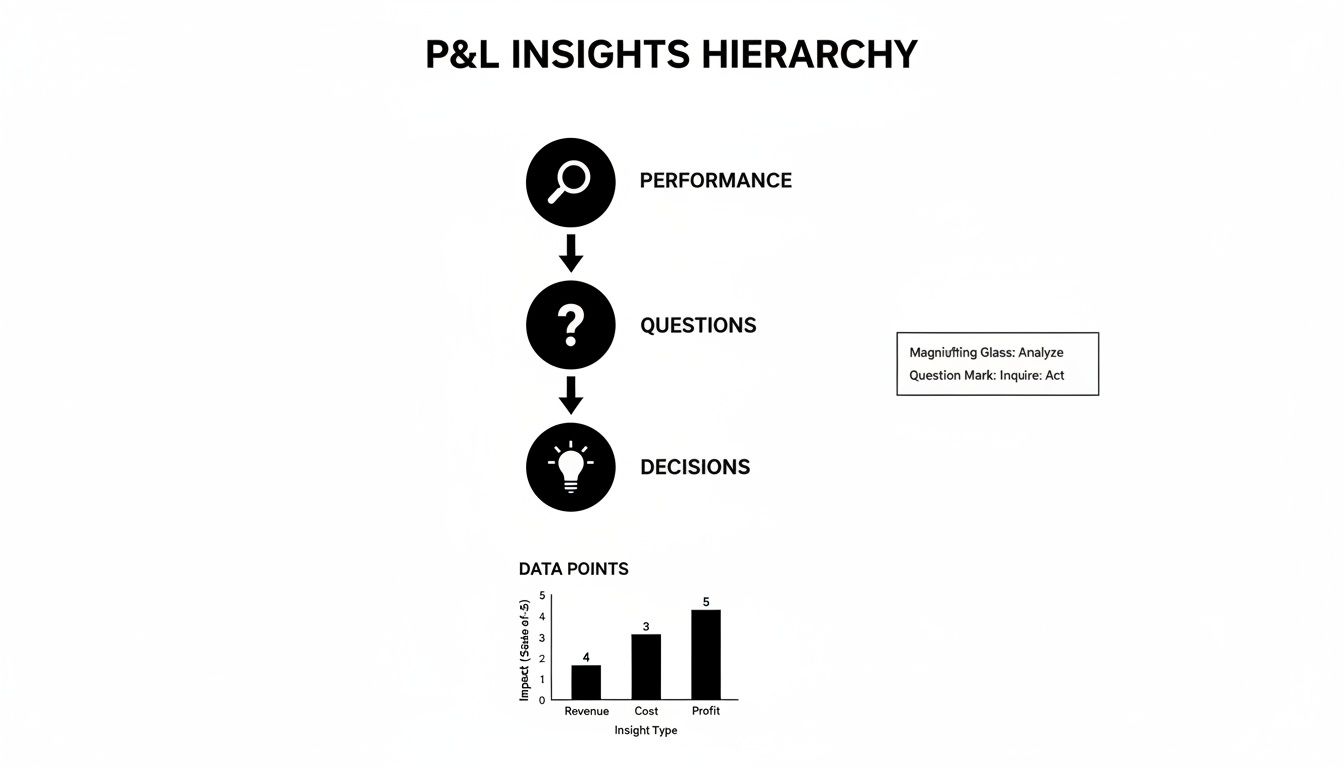
As the diagram shows, once you understand your performance numbers, you can start asking the right questions. Those questions empower you to make smarter, more profitable decisions for the business.
Measuring Core Health with EBITDA
Before we hit the bottom line, many savvy business owners and investors look at EBITDA. It stands for Earnings Before Interest, Taxes, Depreciation, and Amortisation. It sounds like a mouthful, but its job is simple: it measures the raw profitability of your core business operations.
By stripping out non-cash expenses (like depreciation) and financing or tax decisions, EBITDA gives you a "clean" look at how well the business itself is performing. Lenders and investors love it because it helps them compare the operational health of different companies on a more level playing field.
The Bottom Line: Net Profit
Finally, after every single cost has been accounted for—interest on loans, taxes paid to SARS, the depreciation of your equipment—you get to the most important line of all: Net Profit.
This is the famous ‘bottom line’. It is the ultimate test of your company's success for the period.
Gross Profit – Operating Expenses – Interest – Taxes – Depreciation – Amortisation = Net Profit
If this final number is positive, congratulations, you've made a profit. If it’s negative, the business ran at a loss. The net profit tells the complete story, confirming whether all your hard work and business activities actually generated wealth.
Analysing a P&L for a South African Exporter
Theory is one thing, but seeing a Profit and Loss statement in action is where the real understanding clicks. To make this tangible, let's walk through a hypothetical P&L for 'SA Exports Co.', a fictional South African business that makes and sells artisanal leather goods to clients in Europe and the United States.
This example is perfect for any business involved in international trade because it shows exactly how foreign sales, imported materials, and cross-border logistics hit the books. Following the numbers from top to bottom gives you a blueprint for reading your own company’s financial story.
A Look at the Numbers for SA Exports Co
Here’s a simplified P&L statement for SA Exports Co. covering a single financial quarter. We've kept all figures in South African Rand (ZAR) since that's the company's home currency. This layout gives us a clean, top-down view of how the business really performed.
Sample P&L Statement for 'SA Exports Co'
| Line Item | Amount (ZAR) |
|---|---|
| Revenue | R2,500,000 |
| Less: Cost of Goods Sold (COGS) | (R1,100,000) |
| Gross Profit | R1,400,000 |
| Less: Operating Expenses | |
| Salaries & Wages | (R450,000) |
| Rent & Utilities | (R120,000) |
| Marketing & Advertising | (R150,000) |
| International Shipping & Duties | (R200,000) |
| Bank & FX Fees | (R80,000) |
| Total Operating Expenses | (R1,000,000) |
| Operating Profit (EBITDA) | R400,000 |
| Less: Depreciation | (R50,000) |
| Less: Interest Expense | (R30,000) |
| Earnings Before Tax (EBT) | R320,000 |
| Less: Income Tax Expense | (R89,600) |
| Net Profit | R230,400 |
The table gives us the headline figures: from R2.5 million in sales, the company walked away with a net profit of R230,400. Now, let's dig into what those numbers are actually telling us.
Key Insights from the Statement
The first number that jumps out is the Gross Profit of R1,400,000. This is a great sign. It means SA Exports Co. is pricing its products correctly, leaving more than enough to cover the direct costs of leather, materials, and the wages of its artisans.
But the real story unfolds when we get to the Operating Expenses. We see some significant costs that will feel very familiar to any exporter. International Shipping & Duties chew up a hefty R200,000, a major cost centre for any business that moves goods across borders.
One line item that’s easy to overlook but has a massive impact is Bank & FX Fees, sitting at R80,000. That single expense represents over 34% of the company's final net profit. It's a stark reminder of how the costs of converting currency and managing international payments can quietly eat away at your bottom line.
This is a textbook example of a "hidden" cost that directly hammers profitability.
After every single expense, interest payment, and tax deduction is accounted for, the company’s Net Profit stands at R230,400. This is the bottom line, the true measure of success for the quarter. While the business is in the black, the P&L clearly flags specific international costs as prime targets for savings. Pinpointing these details is the first step toward building a much healthier, more profitable business.
Using Key Ratios to Measure Financial Health
A Profit and Loss statement is much more than just a final number at the bottom of a page. Think of it as a diagnostic tool, packed with clues about the true health of your business. A net profit of R230,400 might sound fantastic, but on its own, it's just a number without context.
To really understand what your P&L is telling you, you need to use profitability ratios. These simple calculations transform the raw data into powerful insights, helping you spot trends, measure your performance against others, and ultimately, make smarter decisions. They tell the real story of your company’s efficiency and long-term viability.
Gross Profit Margin: The First Health Check
The first, most fundamental ratio to look at is the Gross Profit Margin. It tells you how efficiently you’re producing and selling your goods, long before any overheads like rent or salaries come into the picture. It’s a direct reflection of your pricing strategy and how well you're controlling production costs.
Here's how you work it out:
Gross Profit Margin = (Gross Profit / Revenue) x 100
For our example company, SA Exports Co., the calculation is: (R1,400,000 / R2,500,000) x 100 = 56%
A 56% margin means that for every Rand of sales, 56 cents is left over to cover all other business expenses and, hopefully, leave a profit. If you see this margin starting to shrink over time, it’s a major red flag. It usually points to rising costs for your materials or increasing pressure to drop your prices to stay competitive.
Operating Profit Margin: The Efficiency Engine
Next up is the Operating Profit Margin. This ratio digs a bit deeper, revealing how much profit your business makes from its core, day-to-day operations. It takes into account both the cost of your goods and all your operating expenses—things like salaries, rent, and marketing.
It’s the truest measure of your management's efficiency.
Operating Profit Margin = (Operating Profit / Revenue) x 100
Looking at the figures for SA Exports Co.: (R400,000 / R2,500,000) x 100 = 16%
An Operating Profit Margin of 16% tells us that after paying for production and running the business, 16 cents of every sales Rand remains. This metric is incredibly useful because it filters out non-operational noise like interest payments and taxes, giving you a pure, unfiltered view of your operational health.
For any business trading internationally, high cross-border transaction costs can really hammer this margin. For example, some remittance costs in the South Africa-Zimbabwe payments corridor can be as high as 12.7 percent. These fees eat directly into the operating and net profit margins of South African exporters—a painful trend that you'd spot immediately by tracking these ratios. For more on this, the IMF has some detailed findings on how these costs impact regional trade in the South Africa-Zimbabwe corridor.
Net Profit Margin: The Final Verdict
Finally, we arrive at the Net Profit Margin—the ultimate bottom line. This ratio calculates how much of each Rand in revenue is left after every single expense, including interest and taxes, has been paid. It’s the final word on your company's overall success for the period.
The formula is:
Net Profit Margin = (Net Profit / Revenue) x 100
For SA Exports Co., the result is: (R230,400 / R2,500,000) x 100 = 9.2%
This means the company gets to keep just over 9 cents in pure profit for every Rand of revenue it brings in. While any positive number is a good start, this ratio becomes truly powerful when you compare it. Is it better or worse than last quarter? How does it stack up against your competitors in the artisanal goods space?
By regularly calculating and keeping an eye on these three key ratios, you can transform your P&L from a static, historical report into a dynamic guide that helps you steer your business toward greater profitability.
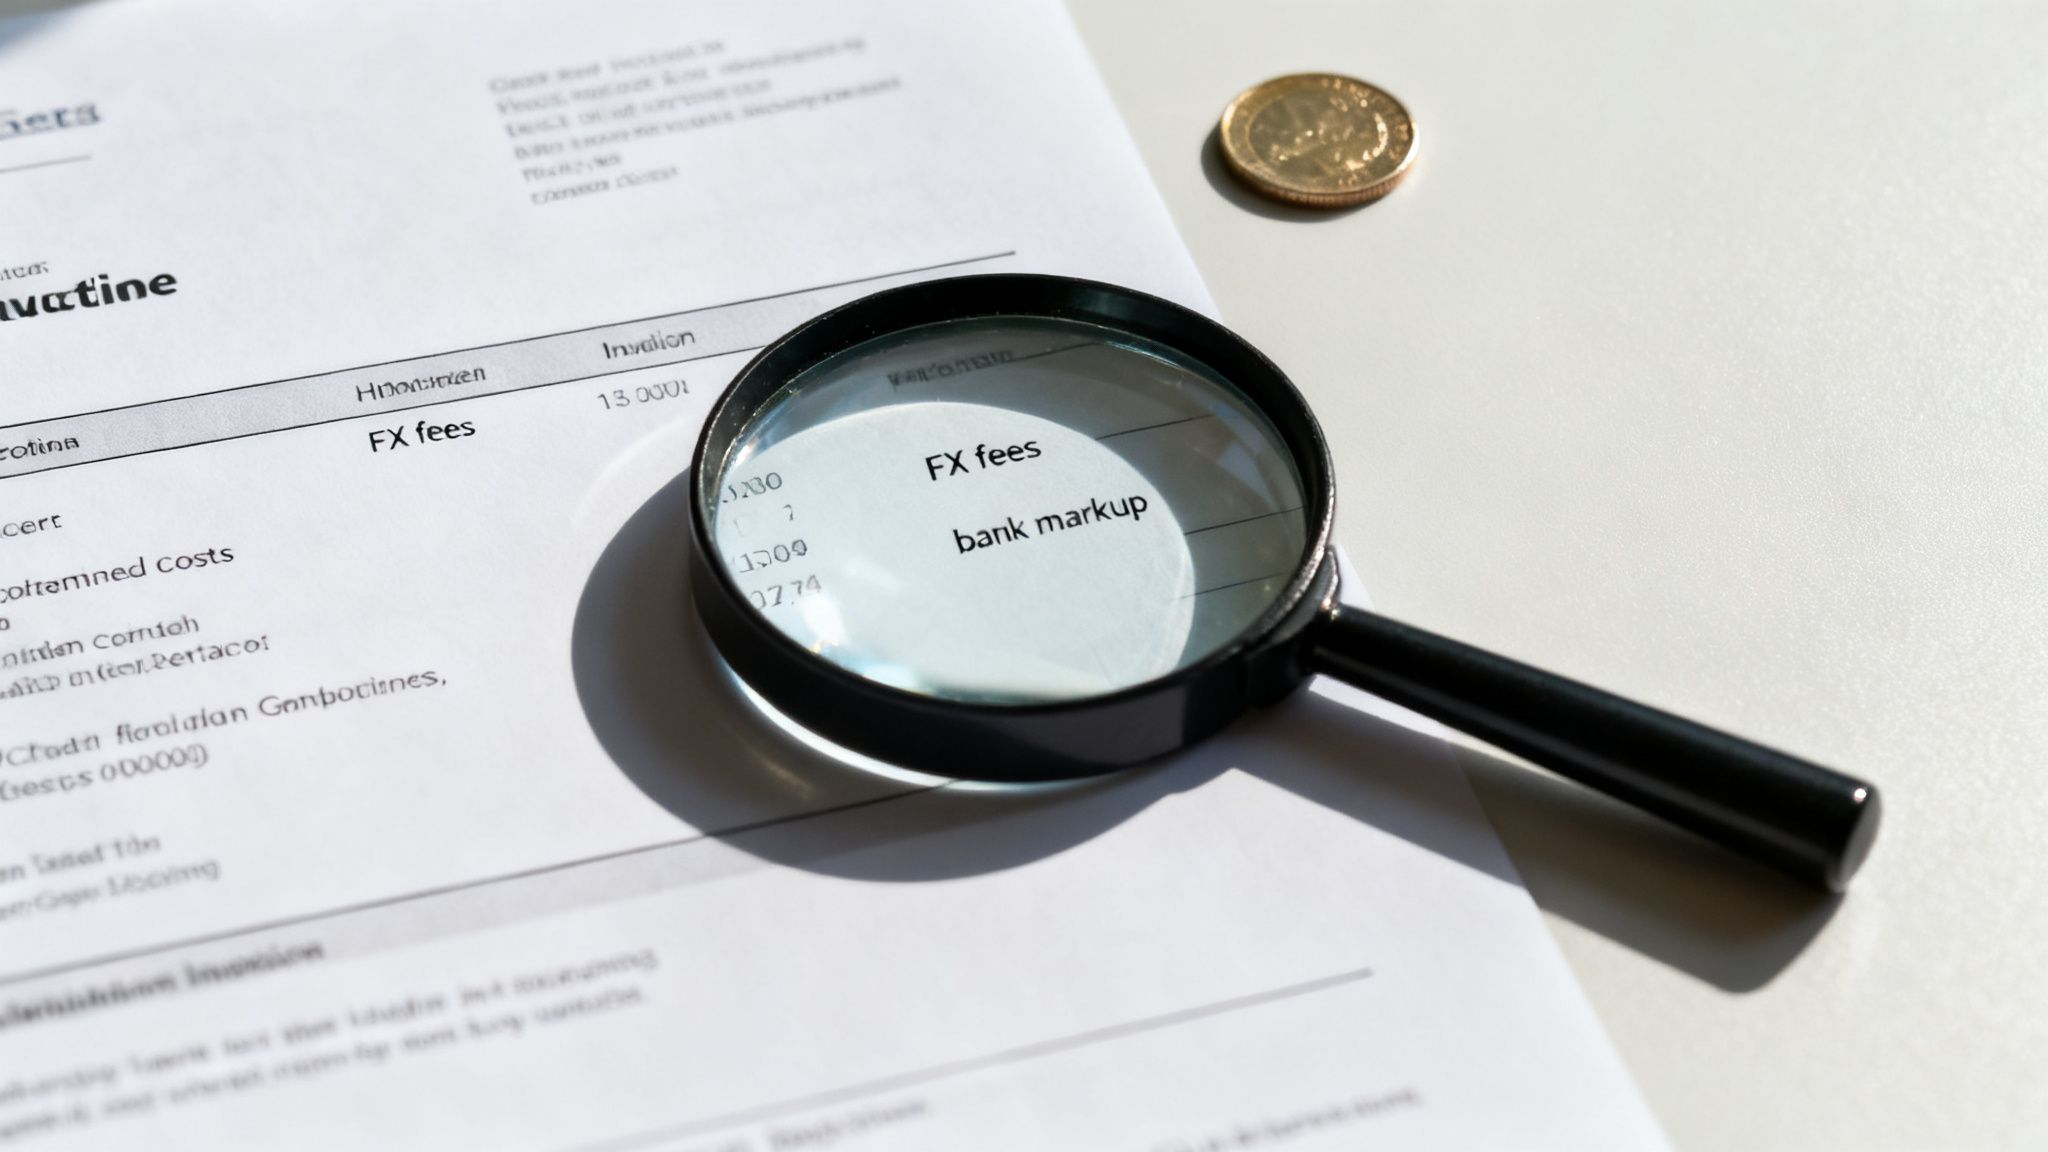
Finding the Hidden Costs That Erode Your Profits
The numbers on your profit and loss statement tell a story, but sometimes the most damaging parts are hidden in plain sight. For any South African business trading internationally, seemingly small line items like "bank fees" or tiny fluctuations in foreign exchange (FX) rates are often silent profit killers.
They represent a constant, quiet drain on your bottom line. What looks like a fantastic sale on paper can quickly become a financial disappointment by the time the money actually lands in your bank account.
The revenue you proudly record at the top of your P&L might not be the revenue you actually receive. This gap is exactly where hidden costs thrive, creating financial unpredictability and directly eating away at your hard-earned net profit.
The Anatomy of a Hidden Cost
Let's walk through how this happens. Imagine your business, SA Exports Co., invoices a client in the United States for $10,000. On the day you send the invoice, the real, mid-market exchange rate is R18.50 to the US Dollar.
Simple maths tells you that you should receive R185,000. You might even book this figure as your anticipated revenue.
But here’s the problem: traditional banking systems rarely give you that real rate. Instead, they sneak in several layers of costs that silently shrink your final payout:
- The Exchange Rate Markup: Your bank might offer you a rate of R18.20 instead of R18.50. This difference, a 1.6% markup, doesn't show up as a "fee." It’s built into the rate itself, and on this one transaction, it instantly costs you R3,000.
- SWIFT and Correspondent Bank Fees: To move money internationally, the payment often hops between several intermediary banks. Each one can slice off its own fee—another R500 to R1,000—often without any warning.
- Receiving Fees: To top it off, your own bank in South Africa might charge a final fee just for processing the incoming international payment, chipping away another few hundred Rand.
All of a sudden, your expected R185,000 has become closer to R180,500. That R4,500 difference is a direct hit to your profit, silently deducted before you ever touch the funds.
From Hidden Costs to Financial Unpredictability
This isn't just about one transaction. When you multiply these costs across dozens or hundreds of international payments, the impact on your overall profit and loss becomes enormous. It creates a massive problem of financial unpredictability.
How can you accurately forecast your cash flow or budget for the future when you have no idea what your true revenue from foreign sales will be? The lack of transparency in old-school cross-border payments means you're constantly guessing.
This financial fog makes strategic planning incredibly difficult. You are essentially operating with incomplete data, where the top line of your P&L statement is an optimistic estimate rather than a reliable fact.
This uncertainty directly undermines your ability to run your business effectively. It's why tools like variance analysis are so crucial; they help you pinpoint exactly where and why your actual profits are drifting away from your plans.
As South African businesses embrace digital payments, the need for transparent cost management is more urgent than ever. Recent data shows South Africa accounted for 78.16% of total transaction value on major digital platforms, with a massive year-over-year growth of 125%. This rapid shift means that sticking with inefficient platforms riddled with hidden fees will only amplify the damage to your profitability.
Ultimately, these hidden fees are not just minor annoyances—they are a direct assault on your net profit. By bringing these costs out of the shadows and into the light, you can start to take back control and ensure the money you earn is the money you actually keep.
Taking Control: Practical Steps to Protect Your Bottom Line
Looking at your P&L is one thing, but making it work for you is where the real magic happens. For any South African SME, especially one dealing with international markets, turning those numbers into decisive action is the key to not just surviving, but thriving. This isn't about a frantic year-end review; it's about building smart, consistent financial habits.

The first step is to stop treating your P&L like a history report and start using it as a roadmap. Make reviewing it monthly a non-negotiable part of your routine. This simple discipline helps you catch problems early. Are your operating costs creeping up? Are margins getting squeezed? Spotting these trends quickly gives you a chance to fix them before they escalate into serious threats.
Get Serious About Cost Control
Once you have a clear picture of your expenses, it's time to get your hands dirty with active cost management. Your P&L is brilliant for this—it shines a spotlight on the biggest cash drains, telling you exactly where to focus. You need to question everything.
- Check Your Supplier Deals: When was the last time you reviewed your agreements? You might be leaving money on the table. Don't hesitate to renegotiate or see who else is out there.
- Dig into Operating Expenses: Look for the leaks. Small adjustments to things like utilities, travel, or even software subscriptions can collectively make a huge difference.
- Tackle Your Biggest Expenses Head-On: Pay close attention to your largest cost categories. If you're an exporter, this is almost always going to be international shipping and, of course, the sneaky fees baked into cross-border payments.
To get the most out of your P&L and ensure you’re making the right strategic moves, bringing in expert help can be a game-changer. This is where Fractional CFO Services can act as a financial co-pilot for your business.
Winning the Foreign Exchange Battle
If your business trades internationally, some of the most frustrating and unpredictable costs are lurking in foreign exchange. The old-school banks are notorious for hiding their fees in terrible exchange rates, which makes it nearly impossible to know how much you'll actually earn from a sale. This is exactly where new financial platforms are stepping in.
Think about it: by using a solution like Zaro that gives you the real mid-market exchange rate with zero hidden markups or transfer fees, you instantly neutralise one of the biggest threats to your profit.
This simple switch changes a volatile, unpredictable cost into a stable, low-cost part of your operations. When you sidestep those bank markups, you’re back in control. The revenue you see on your P&L is the revenue that actually lands in your account. This doesn’t just improve your numbers; it builds a stronger, more predictable, and far more profitable business.
Got Questions About Your P&L? We’ve Got Answers.
Let's clear up a few common sticking points that business owners often run into with their profit and loss statements. Nailing these basics is the first step to making your P&L a genuinely powerful tool for your business.
P&L vs. Cash Flow: What’s the Real Difference?
This is probably the most common question, and it's a critical one. Think of it this way: your P&L statement tells you if you're making money, while your cash flow statement tells you if you have money in the bank.
A P&L looks at your profitability over a specific period (say, a month or a quarter) by matching the revenue you've earned against the expenses you had to pay to get it. The end result is your net profit. But here's the catch: "earned" revenue isn't the same as cash. If you sell R100,000 worth of goods on credit, your P&L shows a R100,000 sale, but your bank account is still empty until the client pays.
That’s where the cash flow statement comes in. It only tracks the actual cash moving in and out of your business. A company can look fantastically profitable on its P&L but still go under because it runs out of cash. You absolutely need both to get the full picture of your financial health.
How Often Should I Be Looking at My P&L?
For your own strategic planning, running a P&L monthly is the gold standard. This gives you a regular, up-to-date snapshot of your business’s performance.
Waiting for a year-end report is like driving by only looking in the rearview mirror. Monthly reviews let you spot trends as they happen, catch problems before they spiral, and make smart decisions on the fly. Of course, you'll still need an annual P&L for official things like tax filings, but the real magic happens when you use it as a month-to-month guide.
A P&L isn't just a year-end chore for the tax man; it's your monthly management compass. Consistent analysis turns old numbers into smart decisions for the future.
Can I Do This Myself, or Do I Need to Hire an Accountant?
The short answer is: it depends. With fantastic accounting software available today, many small business owners can absolutely generate their own P&L statements for internal check-ins. Once you've got your chart of accounts set up properly, the software does most of the heavy lifting.
However, the moment you need to show that P&L to someone else—like a bank for a loan, SARS for your tax return, or a potential investor—it's time to call in a professional. Having a qualified accountant prepare or review your official statements ensures everything is accurate, compliant, and credible. It’s an investment in trust.
Take control of the hidden cross-border fees that eat into your profits. With Zaro, you get the real exchange rate with no markups and zero hidden fees, making your profit and loss statement stronger and more predictable. Learn more about how Zaro can protect your bottom line.