
At its core, a profit loss calculator is a straightforward tool that shows you what’s left after you subtract all your business costs from your total revenue. It gives you a clear snapshot of whether you’re making money or losing it over a set period, which is absolutely fundamental to managing your business well.
Why a Profit Loss Calculator Is Your Business Compass

It’s easy to get bogged down in the day-to-day running of a business. Many owners just glance at their bank balance to see how they're doing. But here’s the thing: a healthy bank account doesn't always mean a profitable business. A profit loss calculator forces you to look past the cash in the bank and face the real numbers that drive your company.
Think of it as your financial compass. It helps you shift from putting out fires to planning for real growth. This isn't just about number-crunching; it's about gaining clarity. When you consistently track your income against your expenses, you start to see the true story of your business's financial health.
Before diving into the calculator itself, it helps to understand what a Profit and Loss (P&L) Statement actually represents. For a bit more background, check out a detailed explanation of the Profit and Loss Statement. This will give you the context to use your calculations strategically.
Turning Data into Decisions
Let’s take a practical example. I once worked with a small e-commerce store whose revenue was climbing, but their profits were flat. It didn't make sense on the surface. By plugging their numbers into a simple profit loss calculator, the owner quickly saw that rising shipping fees and payment processing costs were eating away at their margins, especially on smaller items.
This simple insight led to a game-changing move: they started bundling products to increase the average order value, which made each shipment far more profitable. That’s the power of consistent tracking—it uncovers problems and opportunities that are otherwise invisible.
A profit loss calculation isn't just an accounting exercise; it's a diagnostic tool. It reveals the financial impact of every business decision, from pricing and marketing spend to supplier selection and operational costs.
The numbers you get from these calculations are your secret weapon. They empower you to:
- Optimise Pricing: You can adjust your prices with confidence, knowing exactly what your cost structure and desired profit margins are.
- Control Costs: It becomes glaringly obvious which expenses aren't giving you a good return, helping you cut back without sacrificing quality.
- Identify Profitable Avenues: You can pinpoint which products, services, or clients are your real money-makers, so you can focus your energy where it counts.
- Secure Funding: A detailed P&L is non-negotiable when you’re looking for loans or investment. It proves you have a handle on your finances and a viable business.
The Digital Advantage in Financial Tracking
Using digital tools for this isn't a luxury anymore; it's a necessity for getting an accurate picture. A 2022 survey by the Small Enterprise Development Agency (SEDA) found that around 68% of SMEs in South Africa use digital financial tools—like profit and loss calculators—to keep an eye on their finances.
The results speak for themselves. The businesses using these calculators were 2.3 times more likely to report better profitability and cash flow than those sticking to manual bookkeeping. It’s a clear sign that embracing technology for financial analysis leads directly to better business outcomes.
Building Your First Profit and Loss Statement
Okay, let's move from theory to action. This is where you really start to see what's happening inside your business. Putting together your first Profit and Loss (P&L) statement can feel a bit daunting, I get it. But honestly, it's just a logical process of organising your numbers to get a clear picture of your company's health. Think of it like a financial puzzle – each transaction is a piece, and the finished picture shows you whether you're actually making money.
The first, and most important, part of the process is simply gathering all your financial info. This means you need to be disciplined about collecting every single sale, invoice, and expense receipt. To get this right, you really need a decent handle on the fundamentals of bookkeeping basics. It’s the bedrock of any accurate financial report.
Identifying Your Revenue Streams
Before we can start subtracting costs, you need a crystal-clear picture of what’s coming in the door. Your revenue (or sales) is the total amount of money your business has earned over a certain period. It's the lifeblood of the whole operation.
But don't just lump all your income into one big, vague number. It’s far more insightful to break it down. For an e-commerce store, for instance, you could categorise your income like this:
- Product Sales: This is the obvious one – revenue from selling your actual goods.
- Shipping Fees Charged to Customers: The amount your customers pay you for delivery.
- Affiliate or Partnership Income: Any commission you earn from promoting other products or services.
Getting this granular helps you see exactly where your money is coming from. You might find one product line is crushing it while another is lagging, or that those shipping fees are actually a nice little contributor to your top line. This is where smart, strategic decisions begin.
Calculating Your Cost of Goods Sold
Next up, you need to work out the direct costs tied to the products you've sold. This is known as your Cost of Goods Sold (COGS). It only includes expenses that are directly linked to producing or buying the things you sold.
Let's stick with our e-commerce store example. The COGS would include:
- The cost of buying inventory from your suppliers.
- The price of raw materials, if you make your own products.
- Inbound shipping costs to get those products to your warehouse.
- Direct labour costs if you have staff involved in production.
When you subtract your COGS from your Total Revenue, you get your Gross Profit. This is a crucial metric. It tells you how efficiently you're turning inventory into profit before you even consider your other business expenses.
Detailing Your Operating Expenses
Operating Expenses, which you’ll often hear called overheads, are all the other costs of keeping your business running—even if you don't make a single sale. These are the expenses that keep the lights on and the doors open. I find it helpful to split them into two main buckets.
Fixed Costs are the predictable ones. They stay more or less the same every month, no matter how much you sell. Think of things like:
- Rent for your office or warehouse
- Salaries for your admin team
- Insurance premiums
- Software subscriptions (like Shopify or your accounting tools)
Variable Costs, on the other hand, go up and down with your business activity. These include:
- Marketing and advertising spend
- Transaction fees from payment gateways
- Packaging materials like boxes and tape
- Utilities such as electricity and water
Listing these out properly is non-negotiable. It’s the hidden or forgotten expenses that can completely throw off your numbers and lead to some pretty bad financial planning down the line.
Putting It All Together: A Practical Example
Let’s run the numbers for a fictional South African e-commerce store, "Cape Town Crafts," and see how they did for one month.
1. Revenue:
- Product Sales: R150,000
- Shipping Fees: R10,000
- Total Revenue: R160,000
2. Cost of Goods Sold (COGS):
- Inventory Purchased: R70,000
- Gross Profit: R160,000 - R70,000 = R90,000
That R90,000 Gross Profit is looking good, but it's not the whole story. Now we have to account for all the other running costs.
3. Operating Expenses:
- Rent: R15,000
- Salaries: R30,000
- Marketing: R12,000
- Software Fees: R3,000
- Utilities: R5,000
- Total Operating Expenses: R65,000
Finally, to find the true bottom line, we calculate the Net Profit. This is what you're left with after every single bill has been paid.
Net Profit = Gross Profit - Total Operating Expenses Net Profit = R90,000 - R65,000 = R25,000
So, Cape Town Crafts made a net profit of R25,000 for the month. This is the number that really matters. It guides your future budgets, pricing strategies, and decisions about growth. A simple profit and loss calculator can make running these numbers a quick, routine check-up for your business.
Making Sense of International Payments and Forex
Once your business steps onto the global stage, your finances get a whole lot more interesting. You're no longer just tracking simple revenue and expenses; suddenly, you're wrestling with ever-changing exchange rates, hidden transfer fees, and the sheer unpredictability of the market. This is where a good profit and loss calculator becomes your most valuable tool, helping you see the real cost—and true profit—of every single international transaction.
You simply can’t afford to ignore foreign exchange (FX). The rand-dollar rate you see on the evening news is almost never the rate your business actually gets from the bank. These small differences, known as the "spread," can quietly eat away at your profits over time. Every payment that crosses a border has layers of costs that you absolutely have to account for to understand where your money is really going.
This simple flow shows how it all fits together in a basic P&L calculation.
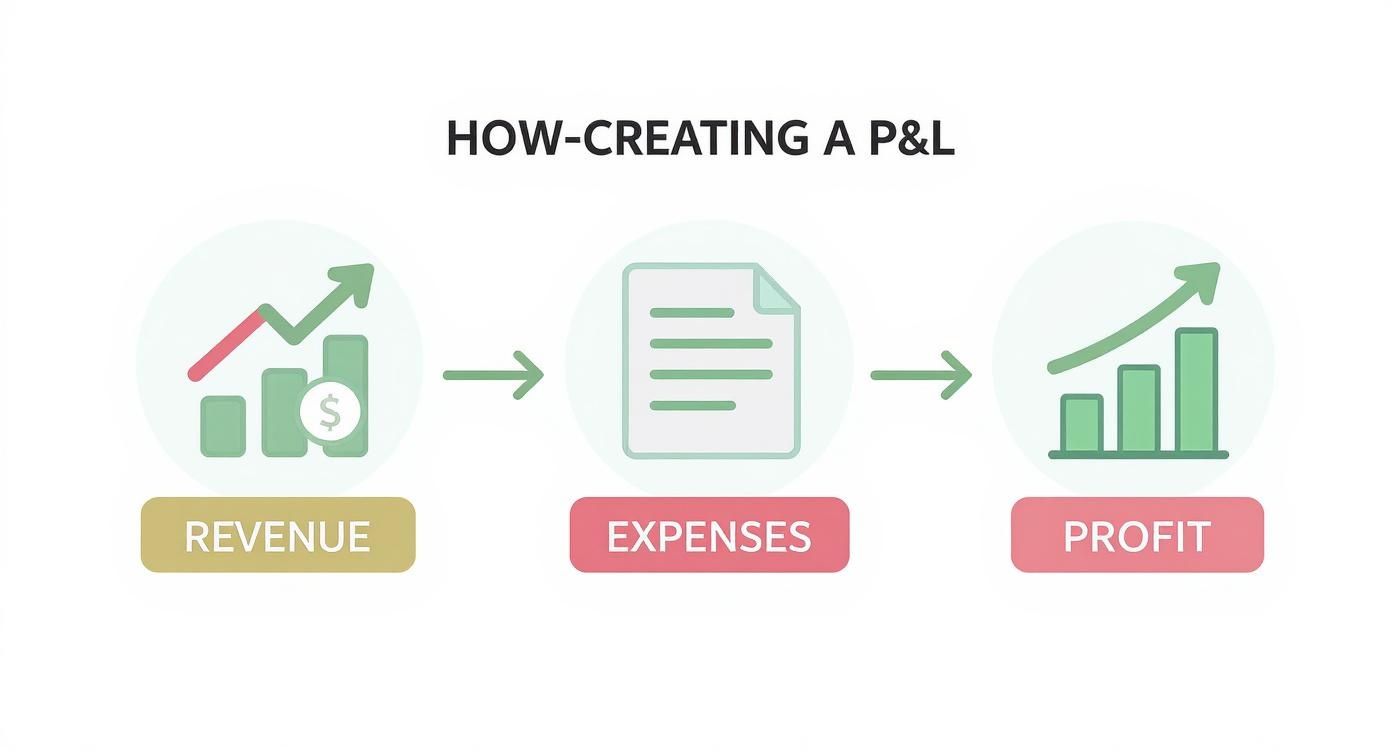
It’s a straightforward journey: from your total income, you subtract all your costs to find your final profit figure. The trick with international business is finding all those costs.
The Real Impact of Shifting Exchange Rates
The biggest headache with international payments is that exchange rates are always on the move. The rate today could be completely different from the rate next week when your payment finally clears, and this volatility introduces a huge risk to your profit margins.
Let's say you agree to buy goods from a US supplier for $10,000. When you shake on the deal, the exchange rate is a comfortable R18.50/USD, making your cost R185,000. But a week later, when it’s time to actually send the money, the rand has weakened to R19.00/USD. Your actual cost is now R190,000.
That’s an extra R5,000 that just vanished from your profit, purely because the market moved against you. If you don't track this in your P&L calculator, you could easily think a transaction was far more profitable than it was.
It's not just about the final number; it’s about timing. The profit you calculate on the day of a sale can be completely different from the profit you realise when the foreign currency is converted and hits your local bank account.
A Real-World Example with All the Hidden Costs
Let’s walk through a classic scenario. Imagine you're a South African business importing artisanal coffee beans from Colombia, and the supplier has invoiced you in US dollars.
The invoice is for $5,000. Here’s how the real costs stack up:
- Spot Rate vs. Your Rate: On payment day, the official mid-market rate might be R18.80/USD. But your bank offers you a rate of R19.15/USD after adding their margin, or spread. That seemingly small difference of R0.35 per dollar is their profit.
- The Initial Rand Cost: Based on the bank's rate, your cost in rands is $5,000 x 19.15 = R95,750.
- Don't Forget Transfer Fees: On top of that, your bank charges a flat international transfer fee (often called a SWIFT fee) of R500.
- The True Total Cost: The final cost you must record in your P&L calculator is R95,750 + R500 = R96,250.
If you had forgotten to include the bank's spread and the SWIFT fee, you'd be understating your costs by R2,250 on this one deal. Over a year of transactions, these "invisible" costs can easily run into the tens of thousands of rands.
Using a Profit and Loss Calculator to Tame Forex Risk
This is where a dedicated profit and loss calculator really shines. Professionals who manage currency risk for a living rely on these tools every day. In fact, a 2023 report from the Financial Sector Conduct Authority (FSCA) found that over 75% of active retail forex traders in South Africa use these tools. The data also revealed that traders who did so were 30% less likely to suffer major account losses, which really speaks to how effective these calculators are for managing currency risk.
For your business, this means you can start actively managing these variables instead of just hoping for the best. Here are a few practical strategies to consider:
- Forward Contracts: Talk to your bank about locking in an exchange rate for a future payment. This removes the uncertainty of market swings and gives you a fixed cost to plug into your P&L.
- Foreign Currency Accounts: Opening an account in a currency you use often (like USD or EUR) can be a game-changer. It lets you avoid converting funds back and forth for every single transaction, saving you a fortune in fees and spreads.
- Timing Your Payments: If you aren’t locked into a specific date, you can monitor exchange rates and try to make large payments when the rate is more in your favour.
By building these international costs and currency fluctuations directly into your profit and loss calculator, you stop guessing and start knowing. This clear financial picture gives you the power to price your products correctly, protect your margins, and make much smarter decisions as you grow your business around the world.
Uncovering Strategic Insights from Your P&L Data
Getting your profit and loss figures calculated is really just the first step. The real magic happens when you start turning those raw numbers into a genuine roadmap for your business. Think of your P&L statement as more than just an accounting chore; it's a goldmine of data just waiting to be analysed. If you dig a little deeper, you can uncover trends, pinpoint inefficiencies, and figure out which parts of your business are truly making you money.
This is where your profit loss calculator transforms from a simple maths tool into a strategic compass. It helps you tackle the big questions: Where are we really excelling? Where are we leaking cash? And, most importantly, what moves should we make next to build sustainable growth? It’s all about getting past the what (your net profit) and understanding the why behind that final number.
Calculating Key Profitability Ratios
To start pulling these insights out, you need to get comfortable with profitability ratios. These are straightforward calculations that put your numbers into context, giving you a standard way to measure financial performance. The two most important ones to get to grips with are the gross profit margin and the net profit margin.
Gross Profit Margin tells you how much profit you’re making from every rand of revenue after covering the direct costs of what you sell (your COGS). A healthy gross margin is a great sign that your core business model—buying or making something and then selling it—is working efficiently.
The formula is pretty simple: (Gross Profit / Total Revenue) x 100
Net Profit Margin gives you the complete picture. It reveals the percentage of revenue left after all your expenses, including operating costs, have been settled. This is the ultimate health check for your overall profitability.
And the formula for that is: (Net Profit / Total Revenue) x 100
A high gross profit margin is fantastic, but if it's paired with a low net profit margin, that's a major red flag. It usually means your overheads or operating expenses are chewing through all the profit you're making from sales.
A Practical Case Study
Let's look at a fictional local bakery, "Durban Delights." After running their numbers for the last quarter through a profit loss calculator, here’s what they found:
- Total Revenue: R300,000
- COGS: R120,000
- Gross Profit: R180,000
- Operating Expenses: R150,000
- Net Profit: R30,000
Now, we can quickly calculate their margins:
- Gross Profit Margin: (R180,000 / R300,000) x 100 = 60%
- Net Profit Margin: (R30,000 / R300,000) x 100 = 10%
That 60% gross margin is really strong. It shows their pricing and ingredient sourcing are on point. But the 10% net margin tells a different story. It suggests their operating costs—rent, salaries, marketing—are swallowing a massive chunk of their profit. This single insight gives the owners a clear direction: they need to scrutinise their overheads, maybe by renegotiating with suppliers or optimising staff schedules, instead of just trying to sell more cakes.
Using Trend Analysis for Deeper Understanding
Your P&L statement becomes even more powerful when you stop looking at it in isolation. By comparing your statements over time—month-on-month or year-on-year—you can perform what's called a trend analysis. This is how you spot the patterns and get a feel for the natural rhythm of your business.
Trend analysis helps you:
- Identify Seasonal Peaks: See which months or quarters are your busiest, so you can plan your inventory and staff levels in advance.
- Measure Campaign Impact: Did that big marketing campaign in May actually lift your net profit, or did it just create a temporary revenue spike with equally high costs?
- Track Cost Creep: Are your utility bills or software subscriptions slowly creeping up without you realising? Comparing P&L statements makes these subtle increases jump out.
This isn't just theory. For example, a 2021 study by the Agricultural Research Council (ARC) found that farms using profit loss calculators saw their net profit margins increase by an average of 12% over two years. This was driven by better cost control and smarter decisions, with one maize farm in the Free State even reporting a 20% profit increase after putting these tools to use. You can read more about these agricultural finance findings to see how it works in practice.
Ultimately, your profit loss calculator is the starting point for all this crucial data. By regularly running your numbers and then taking the time to analyse them with ratios and trend analysis, you turn routine bookkeeping into a powerful strategic planning session. You'll stop reacting to financial surprises and start proactively shaping your company's future.
Key Profitability Ratios and Their Formulas
To make this even easier, here's a quick reference table of some essential financial ratios you can calculate from your P&L. These are fantastic for getting a quick read on your business's performance.
| Ratio | Formula | What It Tells You |
|---|---|---|
| Gross Profit Margin | (Gross Profit / Revenue) x 100 | The profitability of your core products or services before overheads. |
| Operating Profit Margin | (Operating Profit / Revenue) x 100 | How efficiently your business is generating profit from its main operations. |
| Net Profit Margin | (Net Profit / Revenue) x 100 | The overall profitability of your company after all expenses are accounted for. |
| Break-Even Point (in Rands) | Fixed Costs / ((Revenue - Variable Costs) / Revenue) | The total sales revenue you need to generate to cover all your costs. |
Keep this table handy. Regularly calculating these ratios will give you a consistent and clear view of where your business stands and where it's headed.
Your Free Profit & Loss Calculator Template
Knowing the theory is great, but getting your hands on a practical tool is where the real magic happens for your business's finances. To help you move from theory to action, we’ve put together a simple, no-fuss profit and loss calculator template. Think of it as your new best friend for keeping tabs on every transaction, whether you're selling handmade goods or offering consulting services.
It works perfectly with both Microsoft Excel and Google Sheets, so you can crunch the numbers wherever you are. No need to wrestle with building a spreadsheet from the ground up; just plug in your figures and see what they're telling you.
[Download Your Free Profit and Loss Template Here]
How to Use Your New Calculator Template
Once you open the template, you'll find everything laid out in a clean, logical way. We designed it to be intuitive, guiding you through the process of logging your financials without any guesswork. It's more than a blank slate—it's a framework built for clarity.
Here’s a quick tour of what’s inside:
- Revenue Section: This is your starting point for all incoming cash. We’ve broken it down into different streams like product sales, service fees, and even shipping charges, so you get a crystal-clear view of where your money originates.
- Cost of Goods Sold (COGS): Here, you’ll track all the direct costs of what you sell. This could be anything from the raw materials for your products to the wholesale cost of inventory.
- Operating Expenses (Overheads): We've split this into common categories for your day-to-day running costs. You’ll find spots for fixed costs like rent and salaries, plus variable ones like marketing spend and utilities, helping you see exactly where your money is going each month.
The best part? The essential formulas are already built-in. As you enter your revenue and expenses, the template instantly calculates your Gross Profit and, crucially, your final Net Profit. This handy automation means no more risky manual calculations and gives you an immediate, accurate picture of your business's health.
This profit and loss calculator is about more than just logging numbers; it's about building a solid habit. Consistent financial tracking is the bedrock of smart decision-making and sustainable growth for any business, big or small.
Making the Template Your Own
No two businesses are identical, so your financial tracker shouldn't be a one-size-fits-all solution. Our template is completely customisable. Feel free to add new rows, delete categories that don't apply, or rename line items to perfectly mirror your unique income sources and expenses.
If you work with international clients or suppliers, you can easily adapt the template for foreign exchange. I'd suggest adding a column to note the original currency and another for the exchange rate applied to each transaction. This simple step ensures you're capturing the true cost of foreign payments and gives you a much more accurate view of your profitability on cross-border deals.
Got Questions About Your Profit & Loss? We've Got Answers
Even with the best tools in hand, digging into your business finances can feel a little daunting. As you start plugging numbers into a profit and loss calculator, it's natural to second-guess yourself or wonder what the results are really telling you.
Don't worry, that's completely normal. We’ve put together this list to tackle the most common questions we hear from business owners, offering straight-to-the-point answers to help you get comfortable and confident with your P&L.
How Often Should I Be Looking at My P&L?
This is the big one, and the honest answer is: it depends on the rhythm of your business. For official tax and reporting purposes, a formal P&L is usually drawn up quarterly or annually. But for making smart decisions on the ground, you need to be checking in far more often.
For most small and medium-sized businesses, a monthly review is the bare minimum. This gives you enough data to spot trends, catch rising costs before they become major headaches, and react to what's happening in your market. If you’re in a faster-paced industry like e-commerce or retail, where things can change overnight, a weekly check-in is even better.
The point isn't just about bookkeeping. It's about keeping a finger on the financial pulse of your business. The more up-to-date your numbers are, the quicker you can make informed decisions that actually protect your profits.
What’s the Difference Between Profit and Cash Flow?
This is a crucial one that trips up even seasoned entrepreneurs. They are absolutely not the same thing, and mixing them up can land your business in hot water.
- Profit is the number at the bottom of your P&L statement. It’s your total revenue minus all your expenses, showing how profitable your business was over a certain period.
- Cash Flow is the real money moving in and out of your bank account. It’s about liquidity—your ability to pay your bills, your staff, and yourself right now.
Here’s a classic scenario: you can have a wildly profitable month on paper but still have no cash. Imagine you land a huge project and invoice the client. That revenue goes onto your P&L, showing a fantastic profit. But if that client is on 60-day payment terms, the cash won't hit your account for two months. Your P&L looks great, but you still need cash to pay rent next week.
Should I Use a Cash or Accrual Accounting Method?
The accounting method you choose determines when you record your income and expenses, which will naturally change the results in your profit and loss calculator. Both are legitimate, but they tell a slightly different story.
- Cash Method: This is as simple as it sounds. You record income when the cash actually lands in your bank, and you record an expense when you actually pay for it. It gives a very clear, immediate picture of your cash situation.
- Accrual Method: This is a bit more complex but often more insightful. You record revenue when you earn it (like when you send an invoice) and expenses when you incur them (when you receive a bill), not when the money moves. This gives you a more accurate view of your profitability over time.
For tiny businesses just starting out, the cash method often works just fine. But as you grow, most accountants will recommend the accrual method because it provides a truer, more holistic picture of your company's financial health.
Why Are My Profits So High but My Bank Account Is Empty?
Ah, the classic cash-flow crunch. If you're looking at a healthy profit on your P&L but your bank balance is giving you anxiety, you're not alone. This is usually tied to the accrual accounting method we just talked about. You've invoiced for work and recorded the profit, but you're still waiting for clients to pay up.
A few other common culprits for this profit-vs-cash gap include:
- Big Capital Purchases: You bought a new vehicle or expensive equipment. That’s a huge cash outlay, but on the P&L, the cost is often spread out over several years as depreciation, so the immediate hit to your profit seems much smaller.
- Paying Off Debt: Making payments on a loan is a cash expense, but the principal portion of the payment doesn't typically appear as an operating expense on your P&L.
- Buying Stock: If you've just invested heavily in inventory, your cash is tied up in those goods. The expense (Cost of Goods Sold) only gets recorded on your P&L when you actually sell the product.
Getting your head around these dynamics is fundamental to good financial management. Your profit and loss calculator tells you if your business model is working. Your cash flow statement tells you if you can survive to operate it tomorrow. You need both.
Ready to stop guessing and start knowing your numbers with precision? Zaro offers a transparent and efficient way to manage your international payments, eliminating hidden fees and currency exchange markups that eat into your profits. Gain full control over your global finances and see your true bottom line. Learn more and get started with Zaro today.