At its core, a USD/ZAR live chart is your real-time window into the exchange rate between the US Dollar and the South African Rand. It shows you precisely how many Rands it costs to buy one US Dollar at this very moment, making it an essential tool for any business dealing with international payments.
What the USD/ZAR Live Chart Really Tells You
Think of the USD/ZAR live chart not as a dry financial report, but as a live story of supply and demand. It's more than just a line on a screen; it's the real-time result of a constant tug-of-war between the economic health of the United States and South Africa.
For any South African business that pays for imports in dollars, invoices international clients, or simply holds foreign currency, this chart is your financial dashboard. It gives you foresight.
Every movement, whether it’s a sudden spike or a gradual dip, tells a piece of the story. You're seeing the market's instant reaction to breaking news, new economic data, and changing investor confidence. Learning to read this visual language can completely change how you manage your company’s money.
The Story Behind the Numbers
The relationship between the Dollar and the Rand is notoriously volatile. But this isn't just random noise; it's a direct response to very real global and local events.
Recent history is packed with examples. The exchange rate has seen massive swings, reflecting everything from South Africa’s internal economic climate to pressures from abroad. The Rand hit an all-time high of 19.93 ZAR per USD before falling back to around 16.926 ZAR, a perfect illustration of the rapid shifts businesses have to deal with. You can dig into these patterns by exploring historical data on the USD-ZAR exchange rate.
This kind of volatility is typical for emerging market currencies. The Rand is often swayed by a few key factors:
- Commodity Prices: South Africa’s economy leans heavily on exports like gold and platinum. When the global prices for these commodities change, the Rand’s strength follows suit.
- Political Stability: News from Parliament and major policy decisions can trigger sharp, almost immediate reactions in the currency market.
- US Dollar Strength: Actions taken by the U.S. Federal Reserve in Washington D.C. create ripples across the globe, making the Dollar stronger or weaker against all other currencies, including our Rand.
By learning to interpret the USD/ZAR live chart, you shift from being a passive victim of currency swings to an active strategist who can protect your profit margins.
Ultimately, getting comfortable with this chart allows you to make smarter, more timely decisions. It helps you turn what looks like a risk into a real strategic advantage for your business.
What Makes the Rand Move?
Every single tick you see on a USD/ZAR live chart is the end result of powerful economic forces colliding. It helps to think of the Rand's value like a small boat on a big ocean; its direction is dictated by a mix of massive global currents and the immediate local weather. If you want to get ahead of market shifts, rather than just being swept along by them, understanding these drivers is your first step.
The currency market is a 24/7 beast, and the Rand is notoriously sensitive to news, both from across the world and right here at home. A single headline can be enough to cause a noticeable lurch in its value against the Dollar.
The Big Picture: Global Currents and Investor Mood
Often, the most powerful force acting on the Rand isn't local at all—it's the US Dollar itself. When the United States Federal Reserve makes a move on its interest rates, the effects ripple across the entire globe. A rate hike in the US typically makes the Dollar stronger and more attractive to hold, which means it costs more ZAR to buy one USD.
Beyond just central bank policy, the general mood of global investors plays a massive part. You’ll often hear traders talk about a battle between two mindsets:
- Risk-On: When investors are feeling confident and optimistic about the world economy, they're more likely to put their money into emerging markets like South Africa, seeking higher returns. This increased demand for the Rand strengthens our currency.
- Risk-Off: The moment global uncertainty kicks in—think of a major political conflict or a financial crisis—investors run for cover. They pull their money out of what they see as riskier assets and park it in 'safe havens', with the US Dollar being the main one. This flood of capital away from emerging markets weakens the Rand.
A sharp drop on Wall Street can often be a warning sign for the Rand. As global investors get nervous, they tend to retreat from assets they perceive as higher risk, and the ZAR is one of the first to feel it.
This global sentiment is the constant undercurrent. It's always there, pushing the Rand in one direction or another, even when things are quiet on the home front.
On the Ground: Local News and Commodities
While the global tides set the general direction, South Africa's own domestic situation provides the day-to-day drama. Major local news can have a direct and almost instant impact on the ZAR's value, and you can watch it happen live on a chart.
Here are the key local drivers to watch:
- Politics, Politics, Politics: An unexpected announcement from the government, election outcomes, or a major policy change can torpedo or boost investor confidence in a matter of hours.
- Economic Health Checks: Data releases are huge. Reports on inflation from the SA Reserve Bank, the latest GDP growth figures, and unemployment stats all tell a story. Good news generally buoys the Rand, while bad news sends it sinking.
- The Eskom Factor: You can't ignore the lights. The stability of our national power grid is a massive deal for investors. An uptick in load-shedding is often read as a sign of deep economic trouble, putting immediate downward pressure on the currency.
Then there are commodities. South Africa's economy is fundamentally linked to what we pull out of the ground. As a major exporter of precious metals, the Rand often dances to the tune of global gold and platinum prices. When those prices are high, more foreign currency flows into the country, strengthening the ZAR. When they slump, the Rand often follows.
Keeping an eye on these connections is how you start turning a chart from something that just tells you what has happened into a tool that helps you anticipate what might happen next.
How to Read a Live Currency Chart with Confidence
At first glance, a USD/ZAR live chart can look like a jumble of lines and colours. But it's actually telling a story—the story of the Rand's journey against the US Dollar. Learning to read that story is what gives your business a real strategic edge.
This isn't about becoming a Wall Street trader overnight. It's about understanding the market's mood so you can make smarter, more timely financial decisions. Let's break down what you're seeing on the screen so you can confidently interpret the narrative.
Choosing Your View: Timeframes
The first thing you’ll notice on any chart is the option to change the timeframe. You can look at the USD/ZAR's movement over minutes, hours, days, or even months. Think of this not as a zoom button, but as changing your strategic lens.
- Short-Term (e.g., Hourly): This is your ground-level view, showing the day's volatility in detail. It’s perfect for timing a specific transaction, like catching a momentary dip in the Dollar's price to make an international payment.
- Medium-Term (e.g., Daily): This perspective shows the broader trend over the last few weeks. It helps you see if the Rand is in a general strengthening or weakening cycle, which is incredibly useful for weekly cash flow planning.
- Long-Term (e.g., Weekly/Monthly): This is the 30,000-foot view. It smooths out the daily noise and reveals the big picture, which is essential for long-range forecasting, annual budgeting, and shaping your overall hedging strategy.
Flipping between these views lets you see both the forest and the trees. You get the full context needed for immediate action and long-term planning.
Understanding Candlesticks: The Heart of the Chart
Most currency charts use what are called Japanese candlesticks to show price information. Each "candle" is a snapshot of the battle between buyers and sellers within your chosen timeframe (like a single day).
A candlestick has two parts: a thick body and thin wicks. The body shows where the price opened and closed, while the wicks show the highest and lowest points it reached. Typically, a green candle means the price closed higher than it opened (the Rand weakened), and a red one means it closed lower (the Rand strengthened).
This visual map shows all the global and local forces pulling the strings behind the scenes, ultimately shaping the story that each candlestick tells.
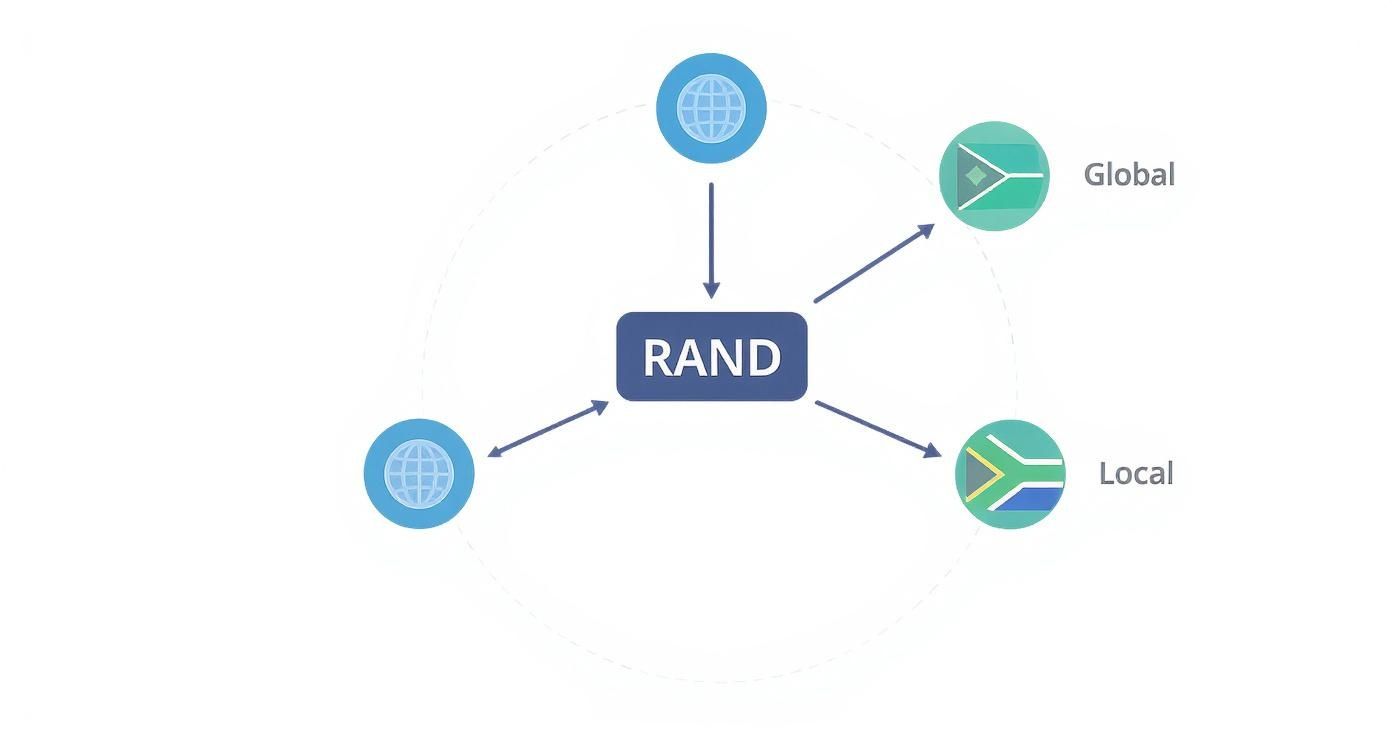
As the infographic makes clear, the Rand's value is deeply connected to both international market sentiment and our own domestic economic health. Both are powerful drivers of the price movements you see on the chart.
Using Key Chart Indicators for Deeper Insight
Beyond the candles themselves, you can overlay indicators on your chart. These are essentially tools that help you interpret the underlying market momentum and trends. Think of them as a GPS for the market, giving you a better sense of where the price might be heading.
Moving Averages are one of the most practical tools for business planning. They smooth out the day-to-day price spikes to reveal the true underlying trend, stopping you from overreacting to a single day's volatility.
Two of the most common and useful indicators are:
- Moving Averages (MAs): These are simple lines drawn over the price chart, showing the average price over a set period, like 50 days or 200 days. If the current price is trading above the moving average, it generally signals an uptrend (a weakening Rand). If it’s below, it suggests a downtrend.
- Volume: Shown as bars at the bottom of the chart, volume tells you how much currency was traded in that period. A big price move on high volume is seen as more significant and confirmed by the market than a move on low volume.
This quick-reference table breaks down what some of these indicators mean in a practical business context.
Key Chart Indicators and Their Business Implications
| Indicator | What It Shows | Business Application (Example) |
|---|---|---|
| Moving Averages (MAs) | The underlying trend by smoothing out price data. | A price cross above the 50-day MA might signal a weakening Rand, prompting you to pay a USD invoice sooner. |
| Volume | The level of market participation behind a price move. | A sharp move on low volume might be a temporary blip, not a true trend change. You might wait for more confirmation. |
| RSI (Relative Strength Index) | Measures the speed and change of price movements to identify "overbought" or "oversold" conditions. | An "oversold" RSI reading could suggest the Rand's recent slide is overdone, presenting a good opportunity to buy Dollars. |
Learning to read these signals is a skill that translates across different financial markets. The core principles of analysing price, trend, and momentum are universal. In fact, understanding how to read cryptocurrency charts can sharpen your overall chart analysis skills immensely. By getting comfortable with these basics, you turn raw data into a powerful tool for your business.
Turning Chart Insights into Smarter Business Decisions
https://www.youtube.com/embed/anRGAPHpzro
Knowing how to read the story a USD/ZAR live chart is telling you is one thing. Turning that knowledge into a real-world business advantage is where the magic happens. For any South African company dealing with international suppliers or clients, these insights hit your bottom line directly. It’s all about shifting from a reactive financial stance to a proactive one.
Let's be clear: this isn't about gazing into a crystal ball to predict the future. No one can do that. Instead, it’s about making calculated, intelligent choices that insulate your business from the wild swings of currency markets. Small, well-timed decisions really do add up to significant savings over the course of a year.
Timing Your International Payments
One of the most practical ways to use this knowledge is in timing payments to your overseas suppliers. Picture this: you have a big USD invoice to settle. If the Rand is weakening, that invoice is costing you more with every passing day. By keeping an eye on the chart, you can spot short-term trends and potential support levels to decide the best moment to act.
For example, if you notice the Rand gaining a bit of strength over a few days (meaning the chart is trending downwards), that could be your golden window to pay that dollar-denominated bill. This simple, proactive step means you get more bang for your buck—or rather, more dollars for your Rand—directly cutting your cost of goods. Of course, to make these kinds of strategic moves, you first need a solid grip on your company’s financial pulse, which always starts with understanding your cash flow.
Developing a Smart Invoicing Strategy
Your invoicing strategy can also get a massive boost from chart analysis. When you're billing an international client, you have a crucial decision to make: invoice them in ZAR or USD? The chart is your co-pilot here.
- If the chart hints at a weakening Rand: Invoicing in USD can work in your favour. When your client pays, you’ll convert those dollars back into more Rands than you might have otherwise, giving your revenue a nice lift.
- If the chart points to a strengthening Rand: Invoicing in ZAR is the safer bet. It locks in the exact revenue you’re expecting and eliminates the risk of receiving fewer Rands than you budgeted for.
Thinking this way turns invoicing from a routine admin task into a powerful tool for managing currency risk.
Practical Hedging to Protect Your Profits
For businesses with larger or more frequent international dealings, hedging becomes an essential defensive strategy. Think of hedging as a way to lock in an exchange rate for a future payment or receipt, which takes the guesswork out of your financial planning. The live chart is your guide for when to pull the trigger.
By watching trend lines and key resistance levels, you can pinpoint moments when the exchange rate looks favourable. That's your cue to lock in that rate with a tool like a forward exchange contract, effectively shielding your profit margins from a sudden, nasty turn in the Rand's value.
Even small, short-term moves can have a big impact. A weekly shift of just 0.88%, as the Rand sometimes appreciates against the dollar, might seem small, but for a business making hefty payments, it's a meaningful saving. Using a chart to spot the very beginning of a trend like that gives you the foresight you need to act—whether that means paying an invoice a bit early or locking in a forward rate before it moves against you.
Bridging the Gap Between the Live Rate and Your Bank Account
Learning to read a USD/ZAR live chart gives you a massive advantage, helping you pinpoint the best time to make your move. But here's the frustrating catch every South African business owner knows all too well: the rate you see on the screen is almost never the rate you actually get from your bank.
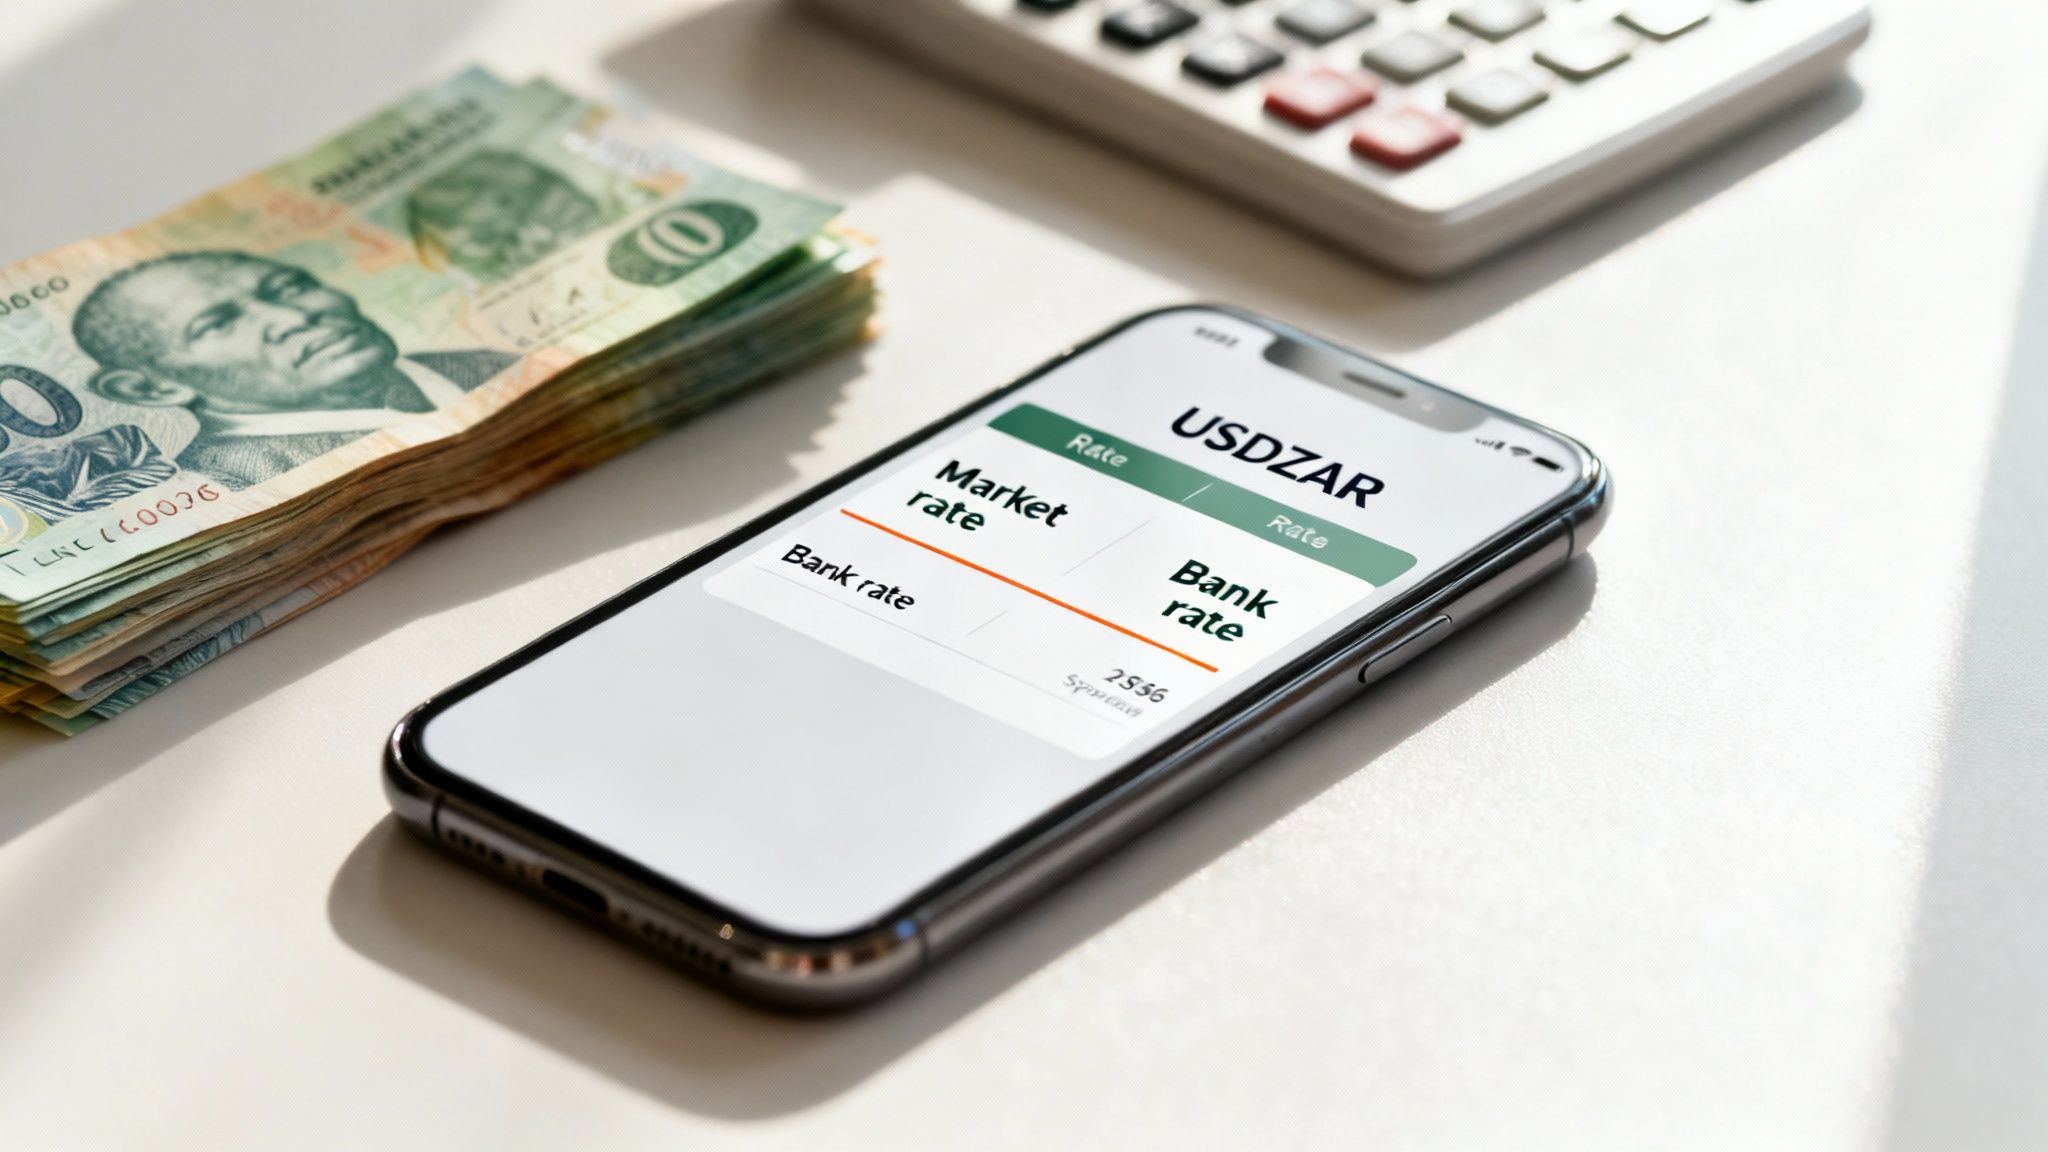
This isn't by accident. It's how the traditional system is designed. The price on the chart is the mid-market rate—the real, wholesale price banks trade at with each other. When you need to make a transfer, the bank simply adds its own profit margin, known as a spread.
This spread silently chips away at your bottom line. Think of it as a hidden fee on every international payment you make. It means you’re always buying dollars for more Rands than the live rate and selling them for fewer Rands. Over a year, those small differences can easily bleed tens of thousands of Rands from your business.
How to Actually Get the Rate You See
This is precisely the problem that modern financial platforms were built to fix. Instead of forcing you to accept the wide, murky spreads offered by traditional banks, these platforms give you direct access to the real exchange rate. The whole idea is to make the number on the chart the same number you get in your transaction.
By working with zero (or incredibly small) spreads, these platforms ensure the valuable insights you get from analysing a chart aren’t lost in translation. You get to keep the savings you strategically waited for. It completely changes the game, turning careful market timing from a theoretical win into a tangible financial gain.
The core principle is simple: transparency. When you transact at the real exchange rate, you cut out the hidden costs that erode your margins. This ensures the benefits of your smart financial timing flow directly to your business.
Turning Your Insight Into Instant Action
Real financial control comes from combining accurate information with the power to act on it immediately. This is where the right technology connects your strategy directly to your bank account, and platforms like Zaro are designed to make this link seamless.
Let's say you've been watching the USD/ZAR live chart and have a target rate of R17.10 in mind to pay a big supplier invoice. Instead of compulsively checking the market all day, you can let technology do the heavy lifting.
- Set up automated rate alerts: You can configure an alert to ping you the second the market hits your target of R17.10.
- Execute the moment it happens: As soon as you get that notification, you can log in and lock in that favourable rate instantly.
This blend of live data, zero-spread execution, and smart automation finally closes the gap between seeing an opportunity and actually capturing its full value. It transforms the USD/ZAR live chart from a passive screen of information into an active, profit-driving tool for your South African business.
Your USD/ZAR Chart Questions, Answered
Diving into foreign exchange charts can feel a bit daunting, especially when your business's money is on the line. It's only natural that questions come up. Here, we'll tackle some of the most common queries we hear from South African business owners who are getting to grips with the USD/ZAR live chart.
Can I Really Use a Live Chart to Predict Where the Rand Is Going?
Think of a live chart as an incredibly detailed map of the past and present, not a crystal ball for the future. It’s brilliant at showing you historical trends, giving you a feel for the current market mood, and flagging important price levels where the rate has turned around before. But it can’t promise what will happen next.
Its real power for your business strategy is in helping you make an educated guess. When you combine what the chart is telling you with a solid understanding of the economic news driving the market, you can anticipate probabilities. It’s about spotting the likely direction of the Rand, not trying to pinpoint an exact number.
When’s the Best Time of Day to Keep an Eye on the USD/ZAR Chart?
The forex market never truly sleeps, but it definitely has its peak hours. For the USD/ZAR pair, the action really heats up when the major global trading sessions overlap, specifically London and New York.
This window—usually between 2 PM and 6 PM South African time (SAST)—is when you’ll see the biggest moves and the highest trading volume. If you’re planning a transaction, it’s also smart to check in around the time of major economic news announcements from either the US or South Africa, as that's when volatility often spikes.
The Rate on the Chart Is Never What My Bank Gives Me. Why?
This is probably one of the biggest frustrations for anyone dealing with international payments. The rate you see on a live chart is the mid-market rate. You can think of it as the 'wholesale' price—it’s the midpoint between what buyers are willing to pay and what sellers are willing to accept on the global market.
Your bank, on the other hand, adds a margin or 'spread' on top of this rate to make their profit. That's why the rate you're quoted is always a little (or a lot) worse than the one you see flashing on the screen. The goal of modern financial platforms is to get you as close to that true mid-market rate as possible, cutting out the hidden costs.
Ready to stop losing money to hidden spreads and fees? With Zaro, you can transact at the real exchange rate you see on the charts. Explore how Zaro gives you transparent and fair global payments.